

AI platform usage continues to grow, but this growth has not translated evenly into website visits. This report compares public research from Adobe, SE Ranking, SearchSignal, and Similarweb to observe changes in AI-recommended traffic across three dimensions: industry, platform, and user behavior. Given that the sample scopes, website compositions, and definitions of "AI-recommended traffic" vary across different reports, this article primarily focuses on trend comparisons and does not directly aggregate percentages from different samples.
Research Background
Over the past two years, when discussing AI search, businesses have often used metrics like platform visits, user numbers, or answer counts to gauge its impact. However, for website operators, the more direct questions are: which industries are actually receiving visits from AI answers, which platforms are these visits coming from, and is the on-site behavior different?
Public research shows that AI platform usage, brand citations in answers, and identifiable referral visits are not synchronized indicators. Users may click links in answers, or after completing comparisons, they might visit via a brand search or directly typing the URL. Therefore, solely observing AI referrals in analytics tools will miss part of the brand discovery and filtering process that occurs before the click. Studying AI search referrals requires simultaneously distinguishing between platform usage, referral visit volume, and the proportion of total website traffic.
AI Referral Traffic Has Reached Multiple Industries, But Distribution is Uneven
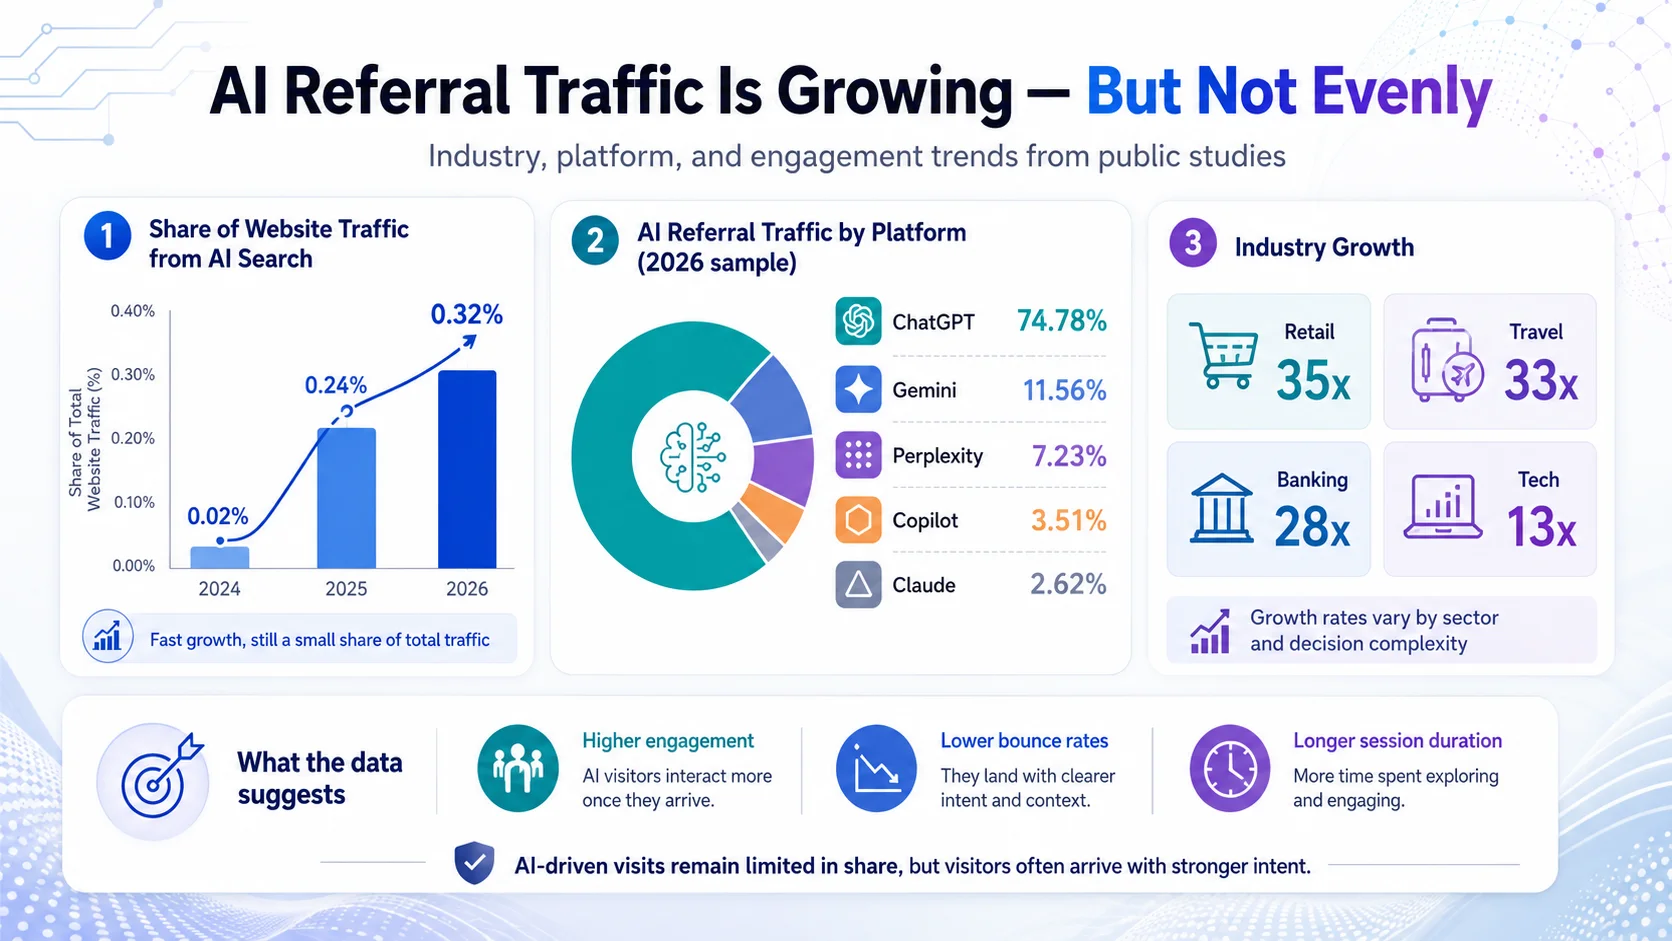
AI referral traffic has entered industries like retail, travel, banking, and technology, but there is a clear discrepancy between growth rates and current traffic share. According to a study released by Adobe in June 2025, from July 2024 to May 2025, AI referral traffic to retail websites grew 35 times, travel 33 times, banking 28 times, and technology 13 times.
The growth multiples describe changes relative to a low starting point and do not mean all industries received the same volume of visits. Adobe's data shows that in May 2025, the share of AI-referred visits for the technology sector was approximately 5 times that of the travel sector and about 10 times that of the retail and banking sectors. Public research from 2025 compiled by SearchSignal also indicates that within its cited industry sample, IT and technology websites could have an AI referral traffic share of up to 2.8%, higher than several other industries.
This difference is related to the types of questions users face. Consumer electronics, home goods, international travel, and financial services often require comparing parameters, prices, risks, and applicability, making users more likely to use AI to organize information. Adobe's retail data also shows that desktop accounts for only 34% of overall retail traffic but 82% of AI-referred visits. This suggests that some users are conducting more in-depth research on larger screens, but it cannot be directly interpreted as all purchase scenarios evolving in the same direction.
| Industry | Observation Period | AI Referral Traffic Change | Engagement Metrics | Source |
|---|---|---|---|---|
| Retail | July 2024 to May 2025 | 35x Increase | May 2025: 27% lower bounce rate, 38% higher visit duration | Adobe, June 2025 |
| Travel | July 2024 to May 2025 | 33x Increase | May 2025: 37% lower bounce rate, 25% higher visit duration | Adobe, June 2025 |
| Banking | July 2024 to May 2025 | 28x Increase | May 2025: 35% higher visit duration | Adobe, June 2025 |
| Technology | July 2024 to May 2025 | 13x Increase | May 2025: Referral visit share ~10x that of retail and banking | Adobe, June 2025 |
AI Referral Traffic Continues to Grow, But Remains in a Low-Base Phase
In terms of total website traffic, AI referral traffic currently shows the characteristic of "fast growth but a small share." According to a study released by SE Ranking in June 2026, the proportion of website traffic from AI search engines rose from 0.02% in 2024 to 0.24% in 2025, further reaching 0.32% in 2026, an increase of approximately 16 times over two years.
The same study shows that in 2026, organic search accounted for approximately 42.75% of sample website traffic, a referral scale about 134 times that of AI platforms. In other words, AI-referred visits can now be consistently identified by analytics tools, but they have not yet replaced organic search as the primary traffic source. A platform having a large user base doesn't mean all those users will click on external links. AI can summarize information, compare products, and filter candidates within the answer interface, thus reducing the necessity to visit third-party websites in some cases.
Estimates of the current share also vary across different studies. In a benchmark report updated in February 2026, SearchSignal aggregated studies from Conductor, Ahrefs, SE Ranking, etc., obtaining an AI referral traffic range of approximately 0.1% to 1.08% of total website traffic, with IT and technology samples potentially reaching 2.8%. The differences mainly stem from industry composition, website scale, geographic scope, and traffic identification methods. Therefore, a single percentage is more useful when compared to its own historical data rather than used as a universal benchmark for all websites.
Businesses also need to differentiate between three concepts: AI platform visits reflect the scale of users entering the platform; AI referral visits reflect the number of users jumping from the platform to a website; AI referral traffic share needs to be calculated against all sources of a website. Confusing these three can easily lead to overestimating or underestimating the actual impact of AI on website operations.
Website Referrals Are Shifting from a Single Platform Concentration to Growth Across Multiple Platforms
Currently, overseas AI referral traffic is still concentrated on ChatGPT, but Gemini, Perplexity, Copilot, and Claude have become sustainably observable referral sources. According to SE Ranking's 2026 sample, ChatGPT accounts for 74.78% of AI referral traffic, Gemini 11.56%, Perplexity 7.23%, Copilot 3.51%, and Claude 2.62%.
ChatGPT's share dropped from 79.74% in 2025 to 74.78% in 2026, but this does not mean its referral visit count decreased. SE Ranking data shows its actual referral traffic grew by 27% year-over-year; the decrease in share is because some smaller platforms grew faster. From 2025 to 2026, Gemini's referral traffic grew by 231%, Claude by 320%, and Copilot by approximately 31%.
These changes suggest that platform share and actual platform referral volume need to be assessed separately. A decline in share for a platform may come from overall market expansion, not a decrease in its own visits. For businesses, monitoring only a single AI engine may fail to capture the evolving structure of referral sources.
AI referral traffic also shows periodic fluctuations. SE Ranking recorded that the proportion of AI referral traffic to total website traffic peaked at 0.3511% in October 2025, then declined during the holiday season and recovered in early 2026. Month-over-month increases or decreases can be influenced by seasonality, product updates, and changes in user demand, and should not be directly extrapolated as long-term trends.
| AI Engine | 2026 Referral Traffic Share | YoY Change or Growth Rate | Observation Notes |
|---|---|---|---|
| ChatGPT | 74.78% | Actual referral traffic grew by 27% | Share down from 79.74% in 2025, but referral volume still growing |
| Gemini | 11.56% | Grew by 231% | Became the second largest referral source in the sample by 2026 |
| Perplexity | 7.23% | Global referral traffic slightly declined | Share affected by the growth rate of other platforms |
| Copilot | 3.51% | Grew by approximately 31% | Smaller in scale, but has formed consistently identifiable referral traffic |
| Claude | 2.62% | Grew by 320% | High growth rate, but current share is still small |
The shares in the table are from the SE Ranking 2026 study sample, reflecting the AI referral traffic structure within its research scope only, not representing a unified market share for all websites or regions.
AI-Referred Visitor Engagement Improves, But Link Attribution Only Captures Part of the Impact
While the volume of AI-referred visits is still small, their on-site engagement is approaching or surpassing that of other sources. Adobe data shows that in May 2025, AI-referred visitors in the retail industry had a 27% lower bounce rate, 38% higher session duration, and 10% more pages per visit compared to non-AI traffic; their revenue per visit was 70% of non-AI traffic. During the same period, AI-referred visitors in the travel industry had a 37% lower bounce rate and 25% higher session duration, while visitors to banking sites had a 35% higher session duration.
SE Ranking's 2026 study found a similar direction: AI-referred visitors in its sample spent an average of 68% more time on site than organic search visitors. One possible explanation is that users have already completed basic information filtering during the AI conversation, arriving at the website with a more specific question. However, session duration alone cannot represent conversion; it needs to be assessed alongside browsing depth, form submissions, transactions, and subsequent return visits.
At the same time, identifiable referral links cannot cover the full impact of AI on purchase decisions. Similarweb's trend observation from October 2024 to early 2026 shows that monthly visits to AI platforms approached 1.5 billion in early 2026, while AI-referred visits roughly remained between 240 million and 280 million per month from mid-2025 to January 2026. Platform usage continues to grow, but external clicks have plateaued, suggesting more research and comparison may be occurring within the chat interface.
After receiving a brand recommendation, a user might also search for the brand name on Google later, or visit the brand's website directly. Standard analytics tools typically record these actions as organic search or direct traffic, unable to automatically link them back to the earlier AI conversation. Therefore, a "flattening of AI referral traffic" does not mean the impact of AI on brand discovery has stopped growing.
The impact of AI search is shifting from "how many clicks it brings" to "which comparisons and decisions it influenced before the user clicked."
Trend Observations and Industry Implications
The impact of AI search on website traffic is moving from a phase of "whether it generates visits" to a more granular stage of observation. Differences between industries have already emerged: technology and complex decision-making scenarios see a higher share of referrals, while retail, travel, and banking continue to grow from a lower base. For businesses, industry benchmarks are more meaningful than broad global averages.
The platform landscape is also changing. ChatGPT still contributes the most identifiable referral visits, but the shares and growth rates of Gemini, Perplexity, Copilot, and Claude differ. As users disperse across multiple AI products, relying on data from a single platform may miss new brand mentions, citations, and referral visits.
Similarly, there is no simple linear relationship between crawling, citations, and referrals. SearchSignal, citing a fixed sample from Cloudflare in July 2025, noted that ChatGPT required crawling an average of 1,091 pages to bring back one visitor, whereas Google's ratio was 5.4 pages. This data indicates that the scale of a platform reading website content does not directly translate to the scale of clicks, but it is not suitable for judging the overall value of a specific platform.
Subsequent evaluation requires placing AI visibility, citation sources, referral visits, brand searches, and direct visits within the same observational framework. Only by consistently recording data within the same time intervals can a business determine whether a change is due to overall platform growth, industry seasonality, or its own content and website structure changes.
Research Implications
When observing the effectiveness of AI search, businesses can expand their focus from a single referral visit metric to four groups of indicators.
- Track the brand's presence, answer position, and citation sources in ChatGPT, Gemini, Google AI Mode, Perplexity, and Google AI Overview.
- Analyze AI referral traffic share, session duration, bounce rate, browsing depth, form submissions, and transaction performance.
- Compare brand search volume and direct visits with changes in AI visibility to observe if there are temporal correlations between different metrics.
- Establish benchmarks by industry, region, question type, and platform, avoiding the use of a single average to judge all markets.
On an execution level, a GEO audit report can help businesses establish an initial visibility baseline; a website structure and Schema check confirms that key information is clear and identifiable; performance monitoring and ongoing data analysis help determine if trends are stable. The focus is not on securing a recommendation in a single answer, but on establishing a repeatable monitoring methodology.
Public data can show the overall direction of global AI referral traffic, but every brand needs to establish its own independent baseline based on its industry, market, and website data. With aipogeo, you can check your brand's real-world visibility across 6 major AI engines in 1 minute, and further observe citation sources and platform differences.
Related Questions
What is the expected share of website traffic from AI search in 2026?
SE Ranking's 2026 sample shows that AI search engines account for approximately 0.32% of total website traffic. Multiple 2025 studies compiled by SearchSignal suggest a range of about 0.1% to 1.08%, with the specific result influenced by industry and sample composition.
Which industries have seen the most significant growth in AI referral traffic?
Adobe data shows that from July 2024 to May 2025, the retail, travel, and banking sectors grew by 35 times, 33 times, and 28 times, respectively. The technology sector had a lower growth multiple, but its referral visit share in May 2025 was still significantly higher than these other industries.
What are the differences in website referral shares between ChatGPT, Gemini, and Perplexity?
In SE Ranking's 2026 sample, they account for 74.78%, 11.56%, and 7.23% of AI referral traffic, respectively. These figures describe the referral visit structure within the study sample and are not equivalent to platform user shares.
Do AI-referred visitors have better session durations and bounce rates compared to organic search visitors?
Multiple industry samples have observed longer session durations and lower bounce rates. SE Ranking data shows that AI-referred visitors spend an average of 68% more time on site than organic search visitors, but businesses still need to assess visit value in conjunction with conversion and revenue metrics.
Why is AI platform visit volume growing while website referral traffic is beginning to plateau?
Some users can complete research, comparisons, and filtering within the AI answer interface, reducing the need to click external links. Users may also later enter a website via brand search or direct visits, causing the AI influence to be recorded under other traffic channels.
How should businesses measure the AI impact that cannot be directly attributed by a referral link?
Businesses can simultaneously monitor AI visibility, citation sources, brand search, direct visits, and referral visits, comparing how these metrics change over the same time intervals. Continuous monitoring is more suitable for identifying trends than a single screenshot.
Compliance Note: This article is based on the reviewed framework and original report outline and does not add or remove any of the four core findings. The structure, two tables, and six related questions are consistent with the framework. Specific figures such as 35x, 0.32%, 74.78%, and engagement metrics are attributed to their respective sources (Adobe, SE Ranking, SearchSignal, or Similarweb) with timeframes specified, and have been cross-checked against public pages. The text does not promise specific results, disparage platforms, or use terms restricted by advertising laws. The strong tag is used once. The CTA uses the standardized phrasing "Run a Free GEO Audit" and "check your brand's real-world visibility across 6 major AI engines in 1 minute."